Last Updated on March 9, 2025 by andrewshih
If you’re struggling with the Critical Path Method (CPM), you are not alone.
The Critical Path Method can be a difficult concept to master, but understanding it is essential for both the PMP certification exam and your role as project manager. Without a clear grasp of CPM, you may struggle with questions that require identifying dependencies, determining the critical path, or calculating float values.
In this blog post, we will boil down the key information you need to master CPM and help you prepare for the PMP exam.
- First, we will cover the essential terminologies you must understand.
- Next, we will draw a network diagram together using the Precedence Diagramming Method (PDM), including a simple trick to draw it easily.
- Then, we will calculate the critical path using two popular approaches – Plus-Minus-One and Zero-Day. For each approach, we will explain how to count the days correctly so that you fully understand how the math works in CPM calculations.
By the end of this guide, you will have a structured, practical approach to tackling CPM on the PMP exam and applying it in real-world projects.
- What is the Critical Path Method?
- Critical Path Method Video
- Key CPM Terminologies
- Network Diagramming Using Precedence Diagramming Method (PDM)
- Calculating the Critical Path
- Comparison of Plus-Minus-One vs. Zero-Day Methods
- How to Count Days in Critical Path
- Step 1: Perform the Forward Pass (Early Start & Early Finish Calculation)
- Step 2: Perform the Backward Pass (Latest Start & Latest Finish Calculation)
- Step 3: Determine the Total Float and Critical Path
- Bonus: Determine the Free Float
- Conclusion
What is the Critical Path Method?
The Critical Path Method (CPM) is a project scheduling technique used to determine the longest sequence of dependent activities that defines the shortest possible time to complete a project. Any task on the critical path that is postponed will result in a delay in project completion, and tasks on the critical path have zero float.
CPM is widely used in:
- Construction projects to sequence activities like excavation, framing, and electrical installation.
- Software development to schedule coding, testing, and deployment phases.
- Manufacturing processes to align production, quality control, and shipment schedules.
- Event planning to coordinate venue setup, vendor management, and guest arrivals.
By analyzing the critical path, project managers can:
- Identify which tasks are time-sensitive and which have scheduling flexibility.
- Optimize resource allocation by focusing on tasks that impact deadlines.
- Adjust project timelines proactively to prevent delays.
Now, let’s dive into the key concepts you must understand before working with network diagrams and critical path calculations.
Critical Path Method Video
Key CPM Terminologies
Before jumping into network diagramming and calculations, it is crucial to familiarize yourself with the fundamental CPM concepts that will help you analyze project schedules effectively.
What is a Network Diagram?
A network diagram is a visual representation of project tasks and their dependencies. It maps out how activities are connected, showing which tasks must be completed before others can begin.
A well-drawn network diagram eliminates confusion and provides a clear roadmap for project scheduling.
Why is a Network Diagram Important?
- It ensures a logical sequence of tasks, helping to avoid scheduling conflicts.
- It highlights parallel activities that can be performed simultaneously.
- It serves as the foundation for critical path and float calculations.
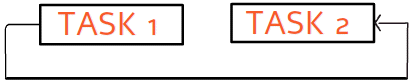
The Precedence Diagramming Method (PDM) is the preferred technique for creating network diagrams in CPM.
- Nodes (boxes) represent activities.
- Arrows indicate dependencies between tasks.
Now that we understand network diagrams, let’s break down the four types of task dependencies.
Four Types of Task Dependencies
When working with network diagrams and the Critical Path Method (CPM), it is essential to understand how tasks are related to each other. Task dependencies define how activities in a project interact and determine the logical order of execution.
| Dependency Type | Definition | Example | Practical Use |
|---|---|---|---|
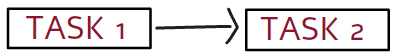
| Finish-to-Start (FS) | Task B cannot start until Task A finishes. | Cannot start painting (Task B) until the walls are built (Task A). | Most common dependency in projects. |
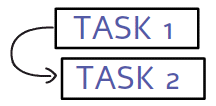
| Start-to-Start (SS) | Task B cannot start until Task A starts. | Cannot start leveling the poured concrete (Task B) until pouring begins (Task A). | Used to reduce project duration. |
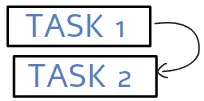
| Finish-to-Finish (FF) | Task B cannot finish until Task A finishes. | Cannot finish testing (Task B) until coding is fully completed (Task A). | Ensures simultaneous task completion. |
| Start-to-Finish (SF) | Task B cannot finish until Task A starts. | Night shift worker (Task B) cannot leave until the day shift worker arrives (Task A). | Least common; used in shift work and system migrations. |
Each dependency type plays a crucial role in sequencing activities correctly and ensuring project tasks are performed in a logical order. Below, we expand on each dependency, providing real-world examples and use cases to illustrate how they function.
1. Finish-to-Start (FS) – The Most Common Dependency
Definition:
In a Finish-to-Start (FS) dependency, Task B cannot start until Task A finishes. This is the most commonly used dependency in construction, software development, and manufacturing projects
How FS Works:
- Task B must wait until Task A is fully completed before it can begin.
- The two tasks do not overlap.
Example 1: Construction Project
- Task A: Pour the foundation of a building.
- Task B: Start erecting the walls.
- Explanation: The walls cannot be built (Task B) until the foundation is fully completed (Task A).
Example 2: Software Development
- Task A: Complete UI design.
- Task B: Start front-end development.
- Explanation: The development team cannot begin coding (Task B) until the UI design is approved and finalized (Task A).
Practical Use in CPM:
- This dependency is used in most project schedules because tasks are often sequential rather than overlapping.
- PMP exam questions frequently include FS dependencies when asking about task sequencing in a project schedule.
2. Start-to-Start (SS) – Overlapping Tasks
Definition:
In a Start-to-Start (SS) dependency, Task B cannot start until Task A has started. However, once Task A starts, Task B can begin at any point thereafter—they do not have to finish together.
How SS Works:
- Both tasks must begin at roughly the same time but can proceed at different rates.
- The second task (Task B) is dependent on Task A starting but does not need to wait for its completion.
Example 1: Construction Project
- Task A: Begin pouring concrete.
- Task B: Begin smoothing and leveling the poured concrete.
- Explanation: The team can start leveling the concrete while it is still being poured—they do not need to wait for Task A to finish completely.
Example 2: Software Development
- Task A: Start coding the back-end.
- Task B: Start developing the front-end.
- Explanation: The front-end and back-end development teams can work simultaneously, but front-end work may depend on having basic API structures from the back-end.
Practical Use in CPM:
- SS dependencies help reduce project duration by allowing overlapping activities.
- PMP exam questions may test your ability to recognize tasks that can be performed in parallel.
3. Finish-to-Finish (FF) – Simultaneous Completion Required
Definition:
In a Finish-to-Finish (FF) dependency, Task B cannot finish until Task A has finished.
How FF Works:
- Both tasks can start at different times but must finish together.
- Task B depends on the completion of Task A, but they may progress at different rates.
Example 1: Writing and Editing a Report
- Task A: Write a report.
- Task B: Edit and proofread the report.
- Explanation: The editing team cannot finish (Task B) until the entire report has been written (Task A). However, editing can begin while sections of the report are still being written.
Example 2: Quality Assurance Testing in Software Development
- Task A: Finish coding a software feature.
- Task B: Finish testing the feature.
- Explanation: Testing can begin before coding is fully completed, but the testing process cannot be fully completed until all coding is done.
Practical Use in CPM:
- FF dependencies ensure simultaneous completion of two dependent tasks.
- PMP exam questions may test your understanding of when tasks need to be completed together.
4. Start-to-Finish (SF) – The Least Common Dependency
Definition:
In a Start-to-Finish (SF) dependency, Task B cannot finish until Task A starts.
How SF Works:
- Task B must be active until Task A begins.
- The tasks do not progress in sequence – rather, the start of Task A controls the end of Task B.
Example 1: Shift Handover in Security Services
- Task A: The day shift worker starts work.
- Task B: The night shift worker finishes work.
- Explanation: The night security guard cannot leave (Task B) until the day security guard arrives and starts their shift (Task A).
Example 2: IT System Migration
- Task A: Activate a new IT system.
- Task B: Deactivate the old IT system.
- Explanation: The old IT system cannot be shut down (Task B) until the new system is online (Task A).
Practical Use in CPM:
- SF dependencies are rare but occur in service transitions, shift-based work, and IT handovers.
- PMP exam questions rarely focus on SF dependencies, but knowing it helps answer tricky scenario-based questions.
Float (Slack)
Some tasks have flexibility in their start or finish times without delaying the overall project. This flexibility is called Float (Slack).
There are two main types of float:
- Total Float – The amount of time a task can be delayed without delaying the overall project.
- Free Float – The amount of time a task can be delayed without delaying its immediate successor task.
Comparison of Total Float vs. Free Float
| Feature | Total Float | Free Float |
|---|---|---|
| Definition | Maximum delay a task can have without delaying the entire project. | Maximum delay a task can have without delaying its immediate successor. |
| Impact | Affects the overall project schedule. | Only affects dependent tasks. |
| Tasks with Zero Float | Critical Path tasks always have zero total float. | Some non-critical path tasks may have zero free float. |
| Formula | Total Float = Late Finish (LF) – Early Finish (EF) | Free Float = Earliest Start of Next Task – Early Finish of Current Task |
| Use Case | Helps determine which tasks have scheduling flexibility in the project timeline. | Helps determine which tasks can be delayed without affecting successors. |
| Example | If Task C has 2 days of total float, it can be delayed for 2 days without affecting the project. | If Task E has 2 days of free float, it can be delayed for 2 days without delaying Task G. |
Total Float
Total Float (TF) is the amount of time a task can be delayed without delaying the project’s completion date.
- Tasks on the critical path have a total float of zero—meaning they cannot be delayed without affecting the project deadline.
- Tasks off the critical path have some total float, meaning they can be delayed up to a certain point before impacting the project.
How Total Float Helps in Project Scheduling
- Allows flexibility for non-critical tasks.
- Helps allocate resources efficiently.
- Identifies which tasks can be delayed if needed without affecting deadlines.
Formula for Total Float
Total Float=Late Start (LS)−Early Start (ES)
or
Total Float=Late Finish (LF)−Early Finish (EF)
Free Float
Free Float (FF) is the amount of time a task can be delayed without affecting the start time of its immediate successor task.
- Unlike total float, which considers the entire project timeline, free float focuses only on the next task in the sequence.
- It helps project managers understand localized flexibility between dependent activities.
How Free Float Helps in Project Scheduling
- Determines task flexibility at a local level (not the entire project).
- Helps prioritize tasks that can be adjusted without affecting successors.
- Useful when allocating resources across overlapping activities.
Formula for Free Float
Free Float=Earliest Start of Next Task−Early Finish of Current Task
Lead and Lag
When defining task dependencies in network diagrams, sometimes you need to adjust the timing between tasks to optimize scheduling. This is done using lead and lag times.
Lead time allows a successor task to start earlier than its predecessor finishes. It is used to shorten project duration by overlapping tasks, which is useful for fast tracking and schedule compression.
Lag time introduces a waiting period between two dependent tasks. It is used when a delay is required before the successor task can begin.
Comparison of Lead vs. Lag in Project Scheduling
| Feature | Lead Time | Lag Time |
|---|---|---|
| Definition | Allows a successor task to start before the predecessor finishes. | Introduces a delay between the predecessor and successor tasks. |
| Effect on Schedule | Shortens project duration by overlapping tasks. | Extends project duration by adding waiting time. |
| Example | Testing starts before coding is completed. | Painting starts after a 3-day drying period. |
| Formula | ES (Successor) = EF (Predecessor) – Lead | ES (Successor) = EF (Predecessor) + Lag |
Forward Pass and Backward Pass
The Forward Pass and Backward Pass methods help calculate start and finish times for each task in network diagrams.
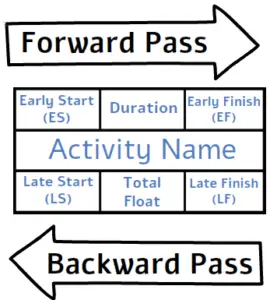
- Forward Pass determines the earliest possible start and finish times by moving left to right in the diagram.
- Backward Pass determines the latest possible start and finish times by moving right to left in the diagram.
- The difference between these values determines float and identifies the critical path.
Network Diagramming Using Precedence Diagramming Method (PDM)
Now that we understand key CPM terminologies, it’s time to draw a network diagram using the Precedence Diagramming Method (PDM). This step is crucial because the network diagram provides a visual representation of task dependencies and helps determine the critical path.
Steps for Drawing a Network Diagram
Many PMP candidates struggle with drawing network diagrams correctly because of task dependencies. Here’s a simple trick:
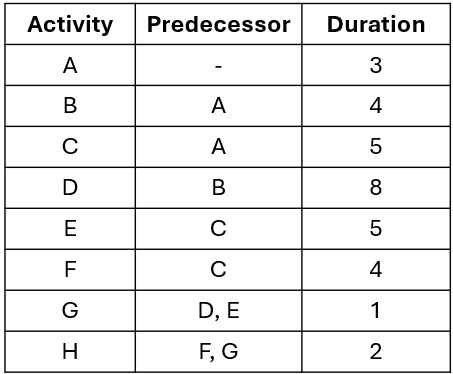
- List all project tasks in a table format, including their durations and predecessors.
- Start with tasks that have no predecessors—these will be the first in your diagram.
- Use boxes to represent tasks and arrows to connect them based on dependencies.
- Work sequentially, adding tasks to the right as dependencies allow.
- Double-check for parallel activities.
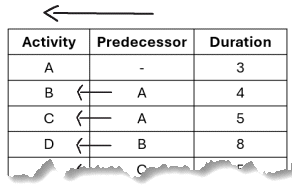
Trick for Drawing a Network Diagram Easily
Here is a little trick that will make it easier to draw the network diagram.
For most people, going from start to finish is easier and comes more naturally. So instead of reading from column 1 to column 2, you may find it easier to read column 2 and then column 1 going from the predecessor to successor.
Step-by-Step Guide to Drawing the Network Diagram
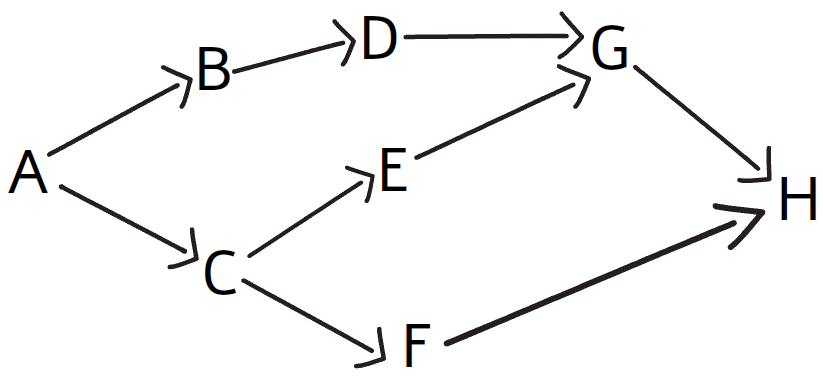
- Start with Task A, since it has no predecessor.
- Draw arrows leading from A to B and A to C, since both depend on Task A.
- Draw arrows from B to D and from C to E and F, as per dependencies.
- Connect D and E to G, since both must be completed before G starts.
- Finally, connect G and F to H, as they are the final dependencies.
Example: Creating a Network Diagram
Here is the final network diagram, which follows the steps and trick above.
Once the network diagram is set up, we can move on to Critical Path Calculations.
Calculating the Critical Path
Now that we have our network diagram, it’s time to calculate the critical path.
To determine the critical path, we will use two methods:
- Plus-Minus-One Method
- Zero-Day Method
Comparison of Plus-Minus-One vs. Zero-Day Methods
| Aspect | Plus-Minus-One Method | Zero-Day Method |
|---|---|---|
| Used In | Tasks take full days to complete. Next task begins on the next day. | Previous task finishes and next task begins on the same day. |
| Calculation Approach | Adds/Subtracts 1 day for start and finish dates | Starts at 0 without adding 1 day |
| Complexity | Slightly more difficult for beginners | Easier and more intuitive |
| Why Use It? | Matches academic and PMI teaching. Precise dates for project activity scheduling. | Easier and practical for project scheduling |
How to Count Days in Critical Path
Rather than trying to remember how to count the days using formal by brute force, it will be much easier and the math will make a lot of sense once you make sense and understand how the days are counted using both approaches.
Counting Days using Plus-Minus-One Approach
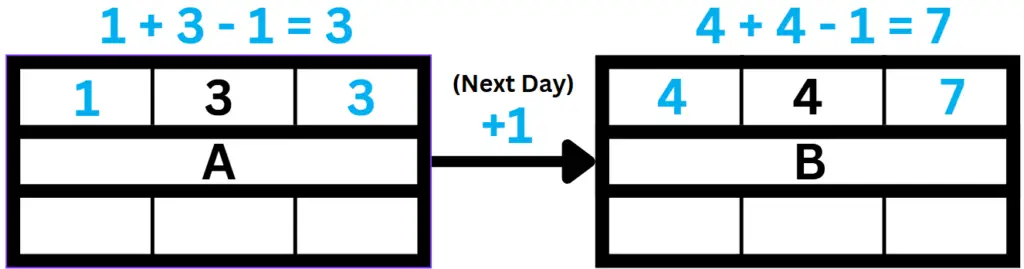
With the Plus-Minus-One approach, we are going to assume one full day means starting the work at the beginning of the day and finishing at the end of the day.
Since it is already the end of the day, the next task will begin the next day in the morning. Therefore, we need to +1 as the starting date for the next activity.
Since you have a full day to work on the first task, we are going to start the day as Day 1.
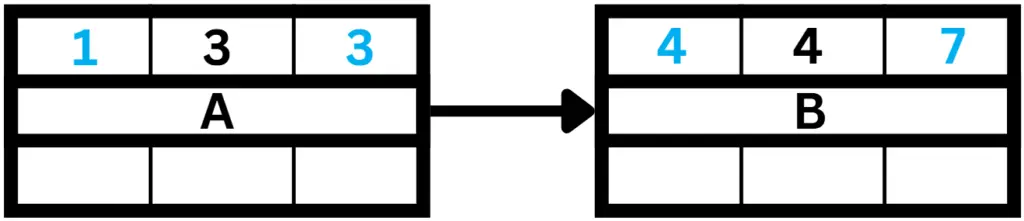
Using the same network diagram from above, Activity A takes 3 days to complete, and Activity B takes 4 days to complete.
Activity A will begin on the morning of Day 1, working full day. Continue on Day 2, and finish the work at the end of Day 3. Therefore, we write down Day 1 as the early start, and Day 3 as the early finish. Since it’s already the end of day on Day 3, the next activities B will start on Day 4.
Activity B will take full days from Day 4, 5, 6, and 7 to complete. So Activity B has an Early Start on Day 4 and an Early Finish at the end of Day 7.
Counting Days using Zero-Day Approach
Not all projects finish activities at the end of the day and begin tasks on the next day. What about projects that have tasks complete during the day (ex., morning), and the next activity continues on the same day (ex., afternoon)? In this situation, the zero-day approach may be more suitable.
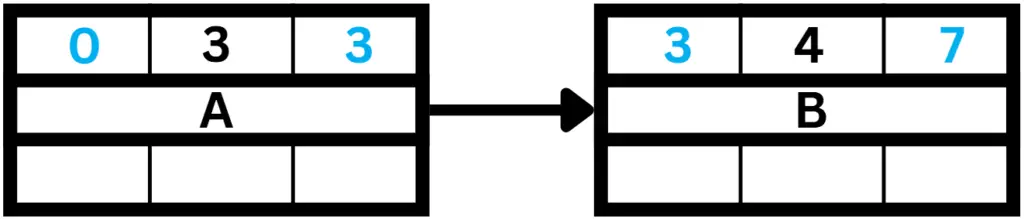
Let’s use the same network diagram from above. Activity A takes 3 days to complete, and Activity B takes 4 days to complete.
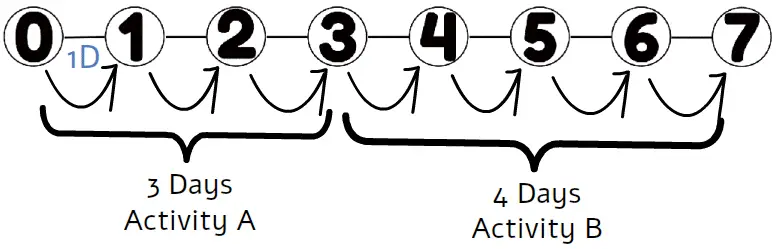
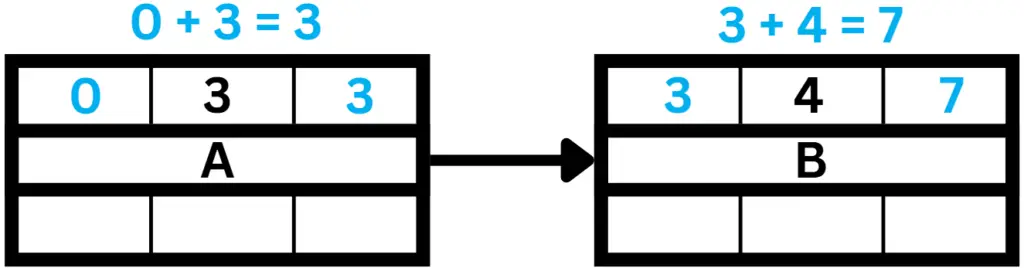
In this case, we are going to start on Day 0, since Activity A does not take a full day and the full day will start from Day 1. We will assume each task starts and finishes at noon, and the next task starts the same day in the afternoon, after the previous task finishes.
Activity A starts at noon on Day 0, continues to noon on Day 1, and this counts as 1 day of work. Between noon on Day 1 and Day 2 counts as the second day. And the noon between Day 2 and Day 3 counts as the third day. So, Activity A starts on Day 0 and finishes on Day 3 as the early finish.
Activity B will start in the afternoon on Day 3 and finish at noon on Day 7. So activity B has an early start on Day 3 and an Early Finish on Day 7.
Once you can rationalize and understand how the days are counted, it will make determining the dates in the forward and backward path much easier.
Step 1: Perform the Forward Pass (Early Start & Early Finish Calculation)
The Forward Pass determines the Earliest Start (ES) and Earliest Finish (EF) for each task by moving left to right through the network diagram.
Forward Path using Plus-Minus-One Approach
Formula:
- Earliest Start (ES) = Earliest Finish (EF) of Predecessor Task + 1
- Earliest Finish (EF) = ES + Task Duration – 1
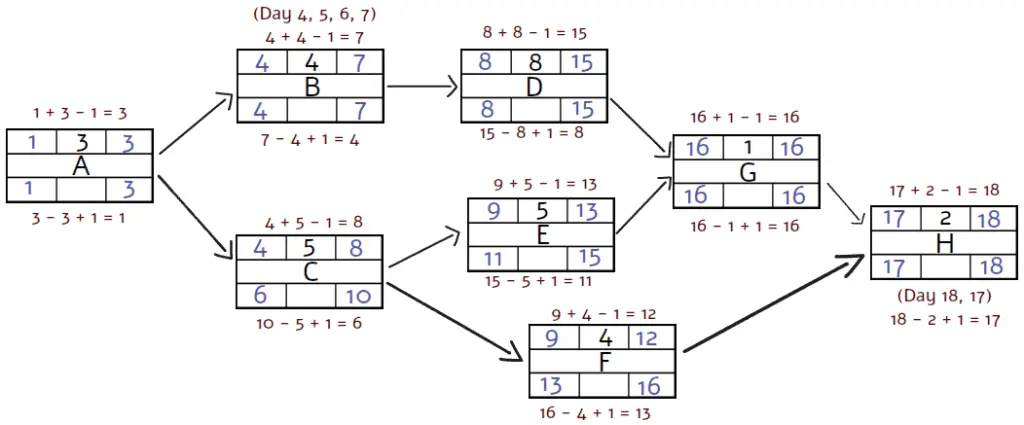
Here is the complete forward path for the Plus-Minus-One Approach:
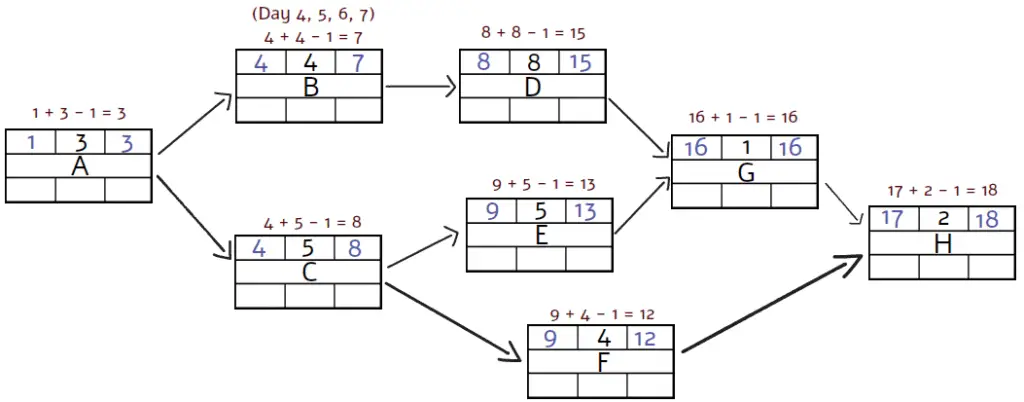
For forward path, if an activity has more than one predecessor, the Early Start of the successor must come from the latest Early Finish of the predecessor.
For example, Activity G has 2 predecessors, Activity D and E. Activity G can only start after Activity D and E are both complete.
Activity D has 15 as the Early Finish. Activity E has 13 as the Early Finish. So Activity G can only start after Activity D is complete at the end of Day 15, and Activity G can only start on the start of Day 16 as the Early Start.
Forward Path using Zero-Day Approach
Formula:
- Earliest Start (ES) = Earliest Finish (EF) of Predecessor Task
- Earliest Finish (EF) = ES + Task Duration
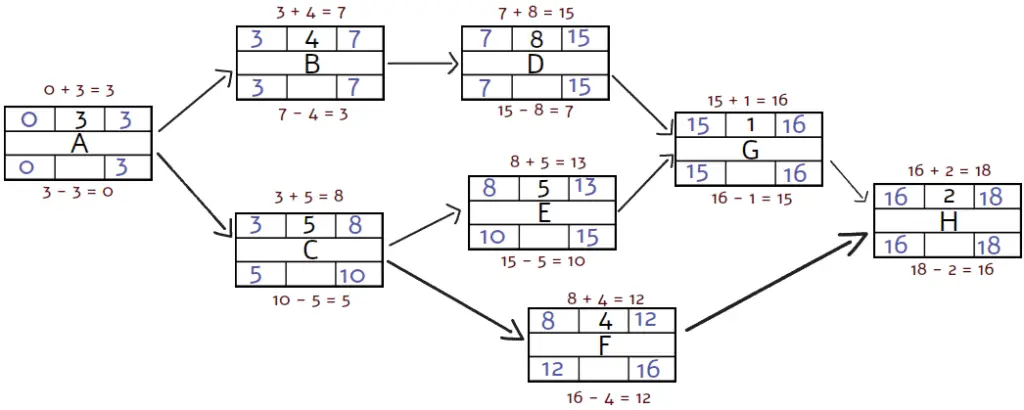
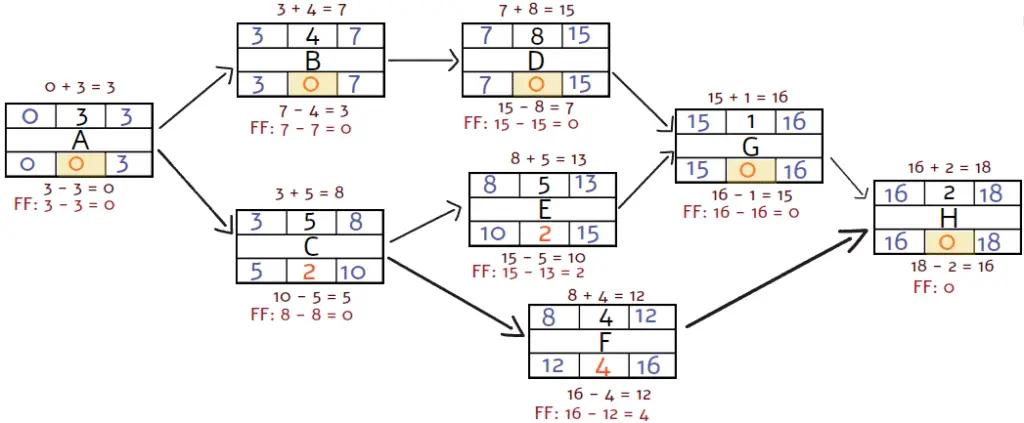
Here is the complete forward path for the Zero-Day Approach:
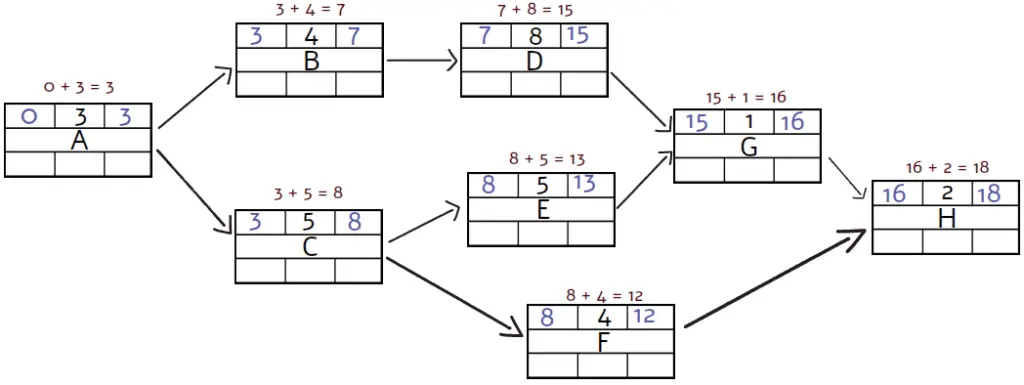
In this case, Activity G has 2 predecessors, Activity D and E. Activity G can only start after Activity D and E are complete.
Activity D has 15 as the Early Finish. Activity E has 13 as the Early Finish. So Activity G can only start after Activity D is complete during Day 15, and Activity G can start later on Day 15 as the Early Start.
Step 2: Perform the Backward Pass (Latest Start & Latest Finish Calculation)
The Backward Pass determines the Latest Start (LS) and Latest Finish (LF) for each task by moving right to left in the network diagram.
Backward Path using Plus-Minus-One Approach
Formula:
- Latest Finish (LF) = Latest Start (LS) of Successor Task -1
- Latest Start (LS) = LF – Task Duration +1
Here is the complete backward path for the Plus-Minus-One Method
If an activity has more than one successor, the Late Finish of the predecessor must come from the earliest Late Start of the successors. For example, Activity C has 2 successors, Activity E and F. Activity E has 11 as the Late Start. Activity F has 13 as the Late Start. Therefore, Activity C must have a Late Finish at Day 10 to accommodate the successors.
Backward Path using Zero-Day Approach
Formula:
- Latest Finish (LF) = Latest Start (LS) of Successor Task
- Latest Start (LS) = LF – Task Duration
Here is the complete backward path for the Zero-Day Method
Again, Activity C has 2 successors, Activity E and F. Activity E has 10 as the Late Start. Activity F has 12 as the Late Start. Therefore, Activity C must have a Late Finish during Day 10 to accommodate Activity E with Late Start for the remainder of Day 10.
Step 3: Determine the Total Float and Critical Path
Now that we have calculated Earliest Start, Earliest Finish, Latest Start, and Latest Finish, we can determine which tasks have zero float (meaning they are on the critical path).
Formula for Float Calculation:
- Total Float = Late Start (LS) – Early Start (ES)
- Total Float = Late Finish (LF) – Early Finish (EF)
You can use one of the formulas above. If you get different results for the activity, it means that at least one of the dates is not correct in your forward or backward path. It is a good sanity check.
You should get the same total float value and critical path using the plus-minus-one and zero-day approaches.
Total Float and Critical Path using the Plus-Minus-One Approach
Thus, the critical path is: A → B → D → G → H.
Total Float and Critical Path using the Zero-Day Approach
Bonus: Determine the Free Float
L.et’s take it one step further and determine the free float. Again, Free Float (FF) is the amount of time a task can be delayed without delaying the earliest start of its immediate successor task.
Unlike Total Float (TF), which considers the overall project completion, Free Float only focuses on the relationship between a task and its next dependent task.
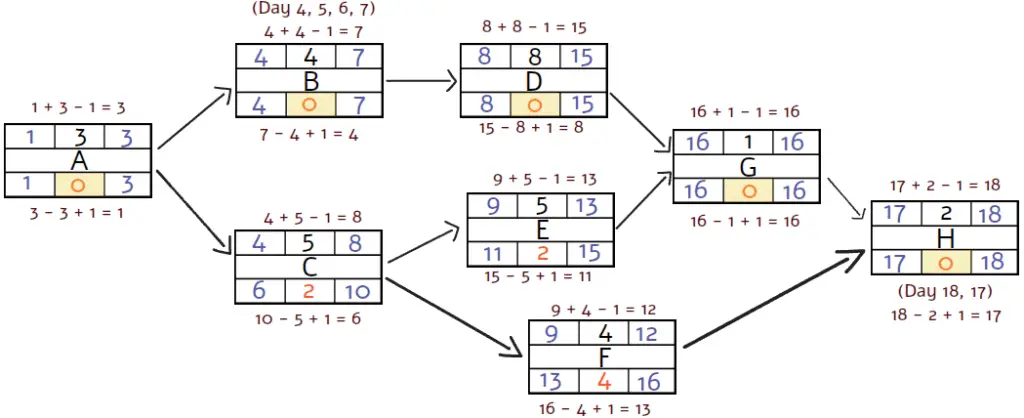
Free Float using the Plus-Minus-One Approach
The formula to calculate Free Float (FF) using the Plus-Minus-One Approach is:
Free Float = Earliest Start of Next Task − Early Finish of Current Task -1
For the plus-minus-one approach, you will need to remember and adjust the Free Float by subtracting 1, because even though the successor always begins on the next day, it’s not considered a float.
The free float is noted using “FF:” in the image below.
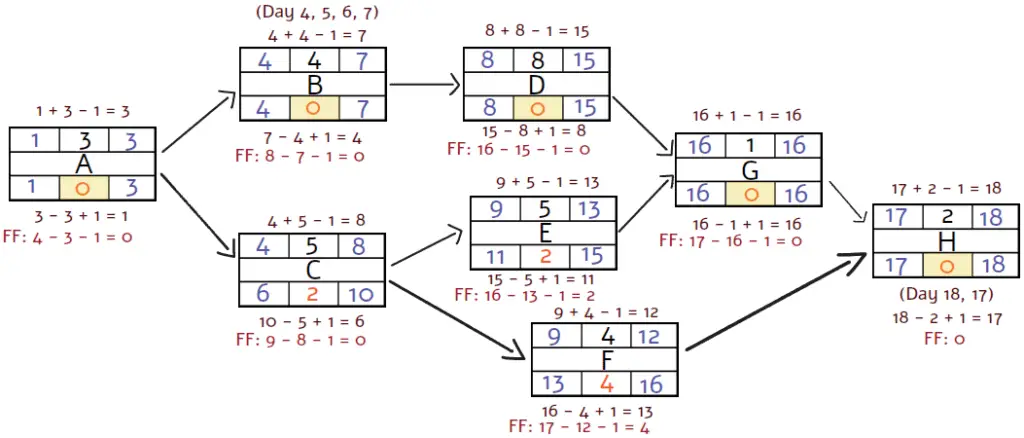
For Activity H, this is the last activity so there is no free float, or free float is effectively 0.
Free Float using the Plus-Minus-One Approach
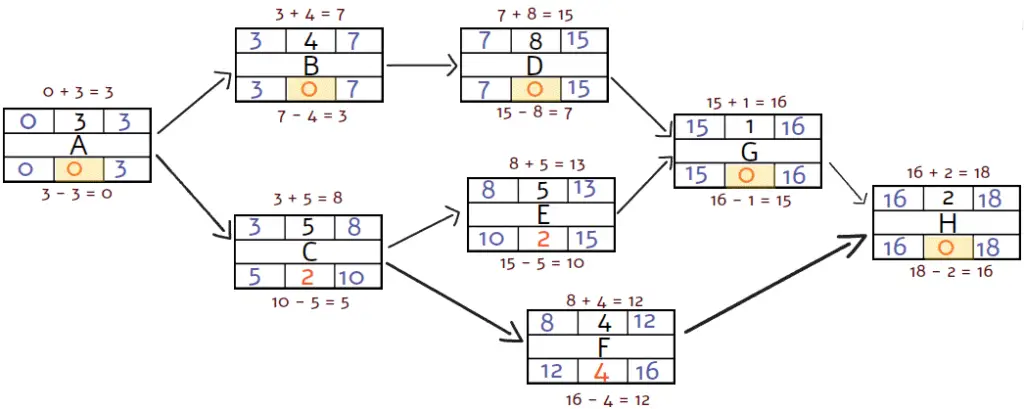
The formula to calculate Free Float (FF) using the Zero-day Approach is:
Free Float = Earliest Start of Next Task − Early Finish of Current Task
Again, the free float is noted using “FF:” in the image below.
Total Float and Free Float side-by-side comparison
Here is a side by side comparison of free float and total float of the activities using the plus-minus-one and zero-day approach.
| Task | Duration | Total Float | Free Float |
|---|---|---|---|
| A | 3 days | 0 | 0 |
| B | 4 days | 0 | 0 |
| C | 5 days | 2 | 0 |
| D | 8 days | 0 | 0 |
| E | 5 days | 2 | 2 |
| F | 4 days | 4 | 4 |
| G | 1 day | 0 | 0 |
| H | 2 days | 0 | 0 |
For most activities, total float and free float have the same values, except for Activity C. If Activity C is delayed for 1 or 2 days, it is going to impact and push back the subsequent activities E and F, but the delay does not (yet) impact the overall project completion date.
Conclusion
Mastering Critical path method is important for your role as a project manager and for real-world project management. By understanding network diagrams, task dependencies, float calculations, and the critical path, you will be able to analyze project schedules with confidence.