Last Updated on March 10, 2025 by andrewshih
PERT charts and Gantt Charts are useful for project planning and management tools. In this article, we will take a deep dive comparing PERT chart vs Gantt chart with their similarities, differences, usages, pros, and cons.
What is a PERT Chart vs a Gantt chart?
What is PERT Chart?
PERT chart stands for Program Evaluation and Review Technique (PERT). This is a graphical representation of a project’s timeline that displays all of the individual tasks necessary to complete the project.
It is a project management tool that helps to schedule, organize, and coordinate tasks, as well as to analyze the project timeline, milestones, resources, and scope. It also helps to estimate the minimum amount of time needed to complete the project. The U.S. Navy created PERT charts in the 1950s for the development of the Polaris missile.
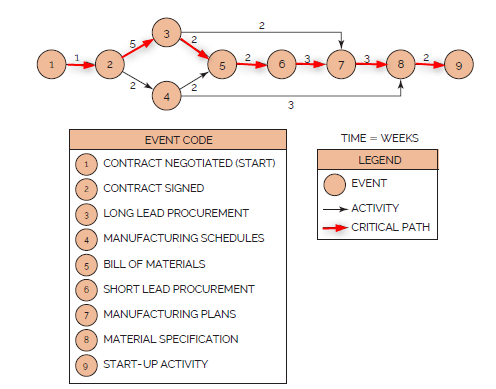
A PERT chart is a visual representation of a series of events that must occur within the scope of a project’s lifetime. The direction of the arrows indicates the flow and sequence of events required.
What is a Gantt chart?
A Gantt chart is a type of bar chart that illustrates a project schedule. This chart lists the tasks to be performed on the vertical axis, and time intervals on the horizontal axis. The width of the horizontal bars in the graph shows the duration of each activity. Henry Gantt developed Gantt Chart in 1900.
Gantt charts are used to plan projects by breaking them down into tasks and subtasks and organizing them into a timeline. They help project managers to visualize project schedules, track progress, and identify potential problems.
In common:
PERT charts and Gantt charts mostly depend on the project type, complexity, and project managers who are seeking the best organizational options for assigning tasks to team members and keeping track of all the moving parts.
Both systems can serve as useful project management tools for arranging project plans and achieving the best outcomes. Both work on PMBOK‘s Work Breakdown Structure.
PERT Chart vs Gantt Chart Examples
PERT Chart Example
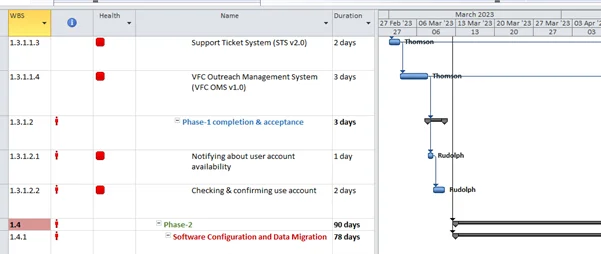
Gantt Chart Example
When to use a PERT chart vs a Gantt chart
When to use the PERT chart
- PERT charts are used during the planning phase of a project.
- Identify the critical path of the project to meet the deadlines
- Plan larger /complex projects
- Estimate the ideal time to start or finish tasks, which allows you to know which tasks need to be prioritized when creating your project schedule.
- To create a realistic project schedule (using Pessimistic, Most Likely, and Optimistic durations).
When to use the Gantt chart
- Gantt charts are typically used when the project is underway.
- To estimate the duration of the project
- These help the project team to work around deadlines and allocate project resources.
- Help to identify the activity relationships and dependencies and milestones.
- When to communicate the stage/progress of the project
- Control workload and resource-leveling.
The following table shows the application of the PERT and Gantt chart under different project scenarios:
PERT Chart vs. Gantt Chart comparison chart
| Features | PERT Chart | Gantt Chart |
|---|---|---|
| Project Scope | Best used during the planning phase of a project, and allow users to map out the full scope. | Are more helpful once a project is underway, as they can be adjusted if the scope changes. |
| Timeline | This has a specific formula used to calculate time estimates for tasks. | Here activities are created and scheduled, allowing for notifications if the timeline is off or a deadline has been missed |
| Flexibility | These charts are challenging to change mid-project, making them a less flexible option | The activities are created and scheduled, allowing for notifications if the timeline is off or a deadline has been missed |
| Task Assignment | This chart allows team members to quickly see which tasks are dependent on each other and who is responsible for what. | These charts tend to be very large and complex, often requiring team members to scroll through many pages to see the big picture. |
PROS and CONS for PERT Chart vs Gantt Chart
PROS and CONS for PERT Charts:
|
|
PROS and CONS for GANTT Charts:
|
|
In common:
PERT charts serve as helpful tools when mapping out a project. Their schematic use of numbers, arrows, and task dependencies allows users to quickly identify potential problems or bottlenecks (if any) that may occur. When managers are in the beginning stages of project creation, PERT charts can be a vital resource for planning and visualizing.
Gantt charts are useful once projects are underway, particularly if there is the possibility of multiple changes as the timeline progresses. Since they utilize bars and lists, these charts are very flexible in terms of illustrating task durations, progress, interdependencies, and resource management.
PERT Chart vs. Gantt Chart Comparison
The following table throws light on “How differently” PERT and Gantt’s chart works as visualizing tools in project management.
| Basis | PERT Chart | Gantt Chart |
| Format | PERT chart is a free-form diagram | A Gantt chart is defined as a bar chart. |
| Development | PERT chart was developed by the United States Navy in 1950 | The Gantt chart was developed by Henry L. Gantt in 1900 |
| Application | PERT chart can be used for large and complex Projects | Gantt chart is often used for Small Projects |
| Usefulness | PERT chart focuses on the dependency of relationships. | Gantt chart focuses on the time required to complete a task |
| Data | PERT charts help plan and estimate time | Gantt charts help track progress and identify bottlenecks |
| Flexibility | PERT chart could be sometimes confusing and complex but can be used for visualizing a critical path | Gantt chart is more straightforward |
| Time | No axes | There is an x-axis to show the project time |
| Work progress | The task shows the % of work completed in the space provided | The filled bar shows the % age of work completion |
| Relationship | Dependent tasks are connected by arrows | Lines connect dependent tasks |
| Chart relates to WBS | Generally used in the planning stages | Generally used in the execution stages. |
Conclusion
Both Gantt and PERT charts are extremely useful tools for project planning and controlling, which can simplify project execution, increase productivity, and make the workflow more transparent with their visual features.
With this, when you know everything about these tools, you can decide which one to use: a PERT chart for project planning or a Gantt chart to track and manage its progress.
Choosing the right tool would depend on the project’s complexity, flexibility, and how it may deviate as the project progresses.
Related Article:
What Is A Project Charter vs Project Plan (Example, Template)