Last Updated on March 23, 2024 by andrewshih
- What is an Affinity Diagram
- Why is an Affinity Diagram Useful?
- How does an Affinity Diagram benefit a team?
- Step-by-Step Process of Creating an Affinity Diagram
- Tips for Creating an Affinity Diagram
- Affinity Diagram Example
- Real-Life Examples Of Using Affinity Diagrams In Different Industries
- Conclusion
- FAQ
What is an Affinity Diagram
An affinity diagram is a handy visual tool for organizing and categorizing ideas or information into logical groups. It helps to make sense of complex data and relationships via visual representations. It is one of the data representation techniques, according to the Project Management Institute (PMI).
The process of creating an affinity diagram involves gathering a diverse range of ideas or data points and then grouping them based on similarities or patterns. This collaborative exercise encourages team members to contribute their thoughts and perspectives, fostering a sense of inclusivity and collective understanding.
Why is an Affinity Diagram Useful?
Affinity diagrams are handy in problem-solving sessions, brainstorming activities, or when analyzing large amounts of qualitative data. Organizing ideas into clusters makes it easier to identify common themes, prioritize actions, and gain insights that may have been overlooked.
Ideas can quickly become scattered during the brainstorming process and difficult to manage. The affinity diagram provides a framework for categorizing and grouping these ideas based on their similarities or themes.
An affinity diagram helps identify patterns and connections between ideas and ensures that no valuable insights are lost or overlooked.
How does an Affinity Diagram benefit a team?
A well-rounded view of the problem and solutions
By organizing diverse ideas into related groups, it allows everyone to contribute their thoughts and insights effectively. This process also helps teams identify common themes or patterns, enabling them to have a better understanding of the problem and a comprehensive view of potential solutions.
Foster teamwork and collaboration
An affinity diagram fosters teamwork and enhances problem-solving by bringing clarity and structure to brainstorming sessions. An affinity diagram is a tool that encourages collaboration among team members.
Step-by-Step Process of Creating an Affinity Diagram
The affinity diagram is a valuable tool for sorting and organizing ideas. Following a simple process helps uncover patterns and make sense of large amounts of information.
Step #1: Define the Problem or Topic
The first step is to define the problem that you want to resolve and want to collect ideas from the team. You should identify and resolve one problem at a time to keep the discussion focused.
Step #2: Brainstorm Ideas
Conduct a brainstorming session to gather ideas about the problem or topic. Encourage participants to contribute freely without criticism.
The goal is to gather all the relevant ideas or pieces of information. This could be in the form of sticky notes, index cards, or any other tangible item representing each idea. Write down each idea concisely on a sticky note or card that captures the essence of each idea.
Step #3: Cluster and Grouping Ideas
Next, it’s time to start organizing and clustering the ideas. Look for common themes or similarities among the collected items and group them together accordingly. This process allows you to see connections and relationships between different concepts.
Step #4: Label the Group and Organize Ideas
Once you have grouped the ideas into clusters, it’s important to label each cluster with a concise heading that captures its essence. This step helps provide clarity and easy reference when analyzing the diagram later.
After labeling the group, take some time to sort the individual items within each group. Arrange them in a logical order that makes sense within the context of your project or objective. This sorting process further enhances the organization and structure of your affinity diagram.
Step #5: Review and Finalize the Affinity Diagram
Review the affinity diagram as a group. Discuss the placement of ideas and make adjustments as needed. Ensure that everyone agrees with the groupings.
Once the group has reached a consensus, finalize the affinity diagram. Consider taking a picture or creating a digital version for documentation.
Tips for Creating an Affinity Diagram
Here are a few tips to help you create an affinity diagram.
- Encourage Participation:
- Ensure that all team members contribute ideas during the brainstorming session.
- Use Sticky Notes:
- Write down each idea on a separate sticky note to make rearranging and organizing easier.
- Stay Focused:
- Keep the discussion focused on sorting and organizing ideas rather than delving into detailed discussions about each idea.
- Be Open-Minded:
- Be open to new perspectives and connections that may emerge during the process.
- Visual Clarity:
- Make sure the diagram is visually clear and easy to understand. Use colors, shapes, or lines to emphasize connections.
- Iterate as Needed:
- Affinity diagrams can be revised and refined based on feedback or changes in the project. Be willing to iterate if necessary.
Affinity Diagram Example
Let’s say you are starting a project with new team members, and you want to work on improving team collaboration in the workplace. You set up a team meeting to gather ideas.
In step #1, you identified “Improve Team Collaboration” as the topic.
In step #2, after a brainstorming session, your team identifies several ideas:
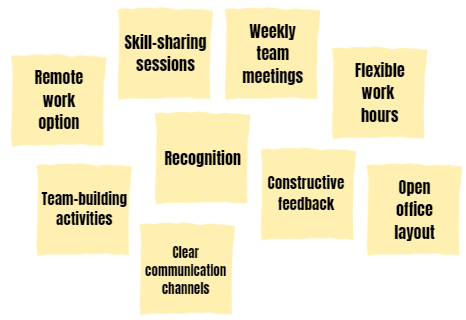
- Flexible work hours
- Team-building activities
- Clear communication channels
- Skill-sharing sessions
- Open office layout
- Remote work option
- Weekly team meetings
- Constructive feedback
- Recognition
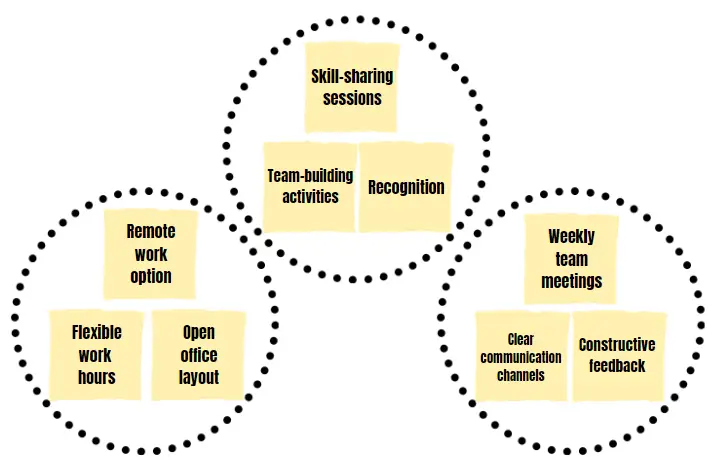
In step #3, your team organizes the idea into groups.
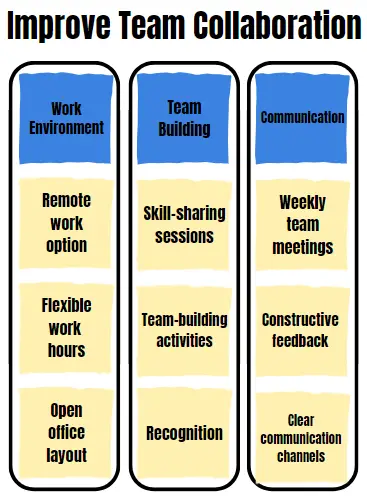
In step #4, your team decided to label the groups as “Work Environment,” “Communication,” and “Team Building.”
In step #5, your team finalizes and captures the affinity diagram as follows:
Real-Life Examples Of Using Affinity Diagrams In Different Industries
Affinity diagrams have proven to be a valuable tool across various industries, aiding in business analysis and project management. Let’s explore some real-life examples of how affinity diagrams have been successfully applied in different sectors.
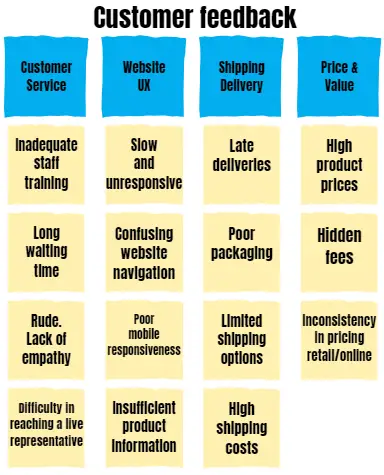
Retail Company – Customer Survey Affinity Diagram
In the field of business analysis, affinity diagrams have been instrumental in organizing and categorizing large amounts of data.
For instance, a retail company used an affinity diagram to analyze customer feedback gathered from surveys and social media. By grouping related comments and opinions together, they were able to identify common themes and prioritize areas for improvement.
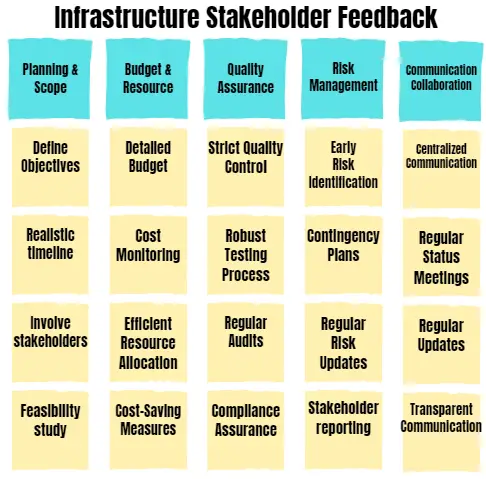
Construction Firm – Stakeholder Ideas Affinity Diagram
A construction firm utilized this technique during the planning phase of a large-scale infrastructure project. They used the diagram to organize stakeholder ideas and suggestions, helping them identify key priorities and allocate resources accordingly.
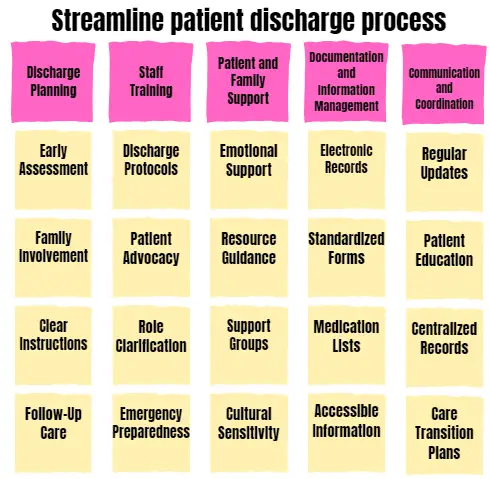
Health Care – Patient Discharge Affinity Diagram
In the healthcare industry, a hospital employed an affinity diagram to streamline their patient discharge process. By mapping out the various steps involved and gathering input from staff members, they identified bottlenecks and implemented changes that improved efficiency and patient satisfaction.
These examples demonstrate the versatility of affinity diagrams in different contexts. Whether analyzing customer feedback, managing projects, or optimizing processes, this powerful tool has proven its value time and again across industries.
Conclusion
In summary, an affinity diagram is a valuable tool for visualizing connections and organizing information meaningfully. It promotes collaboration and helps teams make informed decisions based on the collective wisdom of its members.
For more project management tools, check out our resource page.
FAQ
When is it appropriate to use an Affinity Diagram?
An affinity diagram is very useful when dealing with challenging problems that require collecting ideas from various stakeholders and team members. It is often applied in project management, process improvement, and collaborative decision-making.
Can I use digital tools to create an Affinity Diagram?
Yes, digital tools can be used to create virtual affinity diagrams. Online collaboration platforms, mind-mapping software, or specialized affinity diagram tools allow teams to work together remotely.
Are there any limitations to using Affinity Diagrams?
While powerful, affinity diagrams may oversimplify complex issues. They also rely on the quality of input during the brainstorming phase. Additionally, personal biases can influence the categorization of ideas.
Can an Affinity Diagram be modified or updated?
Yes, affinity diagrams are dynamic and can be revised as new information emerges or project requirements change. Regular updates may be necessary to reflect the evolving understanding of the problem or topic.
Are there alternatives to Affinity Diagrams?
Yes, other similar tools include mind maps, concept maps, and fishbone diagrams. The choice depends on the project’s needs and the team’s preference.
How can I ensure successful implementation of an Affinity Diagram?
Ensure team members understand the process, encourage open communication, and provide training if needed. Keep the atmosphere positive and focused during the brainstorming session, and be open to feedback and adjustments throughout the creation process.