Last Updated on January 29, 2025 by andrewshih
The Cause and Effect Diagram, also known as the Fishbone or Ishikawa Diagram, is a useful visual tool that aids in identifying and understanding the root causes of a problem.
In this comprehensive guide, we will explore the intricacies of the Cause and Effect Diagram, providing a step-by-step procedure, a practical example, and resources for implementation.
- What Is Cause And Effect Diagram
- When To Use A Fishbone Diagram
- Strengths of Cause and Effect Diagrams
- Weaknesses of Cause and Effect Diagrams
- How to Create Fishbone Diagram Step-by-Step
- Tips for Creating a Cause and Effect Diagram
- Cause and Effect Diagram Examples
- Cause And Effect Diagram Complimentary Techniques
- FAQ
What Is Cause And Effect Diagram
Cause and Effect Diagram is a graphical representation that illustrates the cause-and-effect relationships within a system or a specific problem.
Developed by Kaoru Ishikawa, this diagram is widely used in various industries to analyze complex issues and facilitate effective problem-solving.
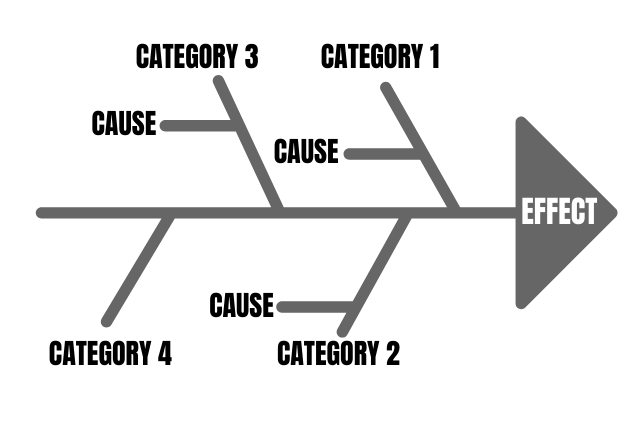
The diagram gets its name from its fishbone-like structure, where the problem statement is placed at the “head,” and various potential causes branch out like the “bones” of the fish.
The primary purpose of an Ishikawa Diagram is to provide a comprehensive and structured method for identifying, categorizing, and analyzing the factors that contribute to a specific problem.
By visually organizing potential causes into distinct categories, the diagram helps teams and individuals gain a clearer understanding of the relationships between different elements of a system, process, or situation.
When To Use A Fishbone Diagram
Here are some instances when using a Fishbone Diagram is particularly beneficial:
Complex Problem Solving
When faced with a complex problem that involves multiple factors and potential causes, a Fishbone Diagram can help break down the complexity into manageable categories. It provides a structured approach to understanding the interrelationships among different elements contributing to the issue.
Quality Improvement
In industries that prioritize quality control, such as manufacturing or healthcare, a Fishbone Diagram is often used to investigate defects, errors, or deviations from standards. It helps teams explore and address the underlying causes affecting product or service quality.
Process Improvement
When analyzing and improving business processes, a Fishbone Diagram can be instrumental in identifying bottlenecks, inefficiencies, or breakdowns in the workflow. By categorizing potential causes, teams can streamline processes for increased efficiency.
Project Planning
During the planning phase of a project, a Fishbone Diagram can be used to anticipate potential challenges and risks. It aids in proactive problem identification and mitigation strategies, contributing to more successful project outcomes.
Team Collaboration
When teams are working on a shared goal or project, a Fishbone Diagram encourages collaborative brainstorming sessions. It provides a visual platform for team members to contribute their insights and perspectives, fostering a collective understanding of the problem.
Customer Complaints
In customer-centric industries, a Fishbone Diagram can be deployed to investigate and address customer complaints. It helps identify the underlying causes of dissatisfaction and guides the development of strategies to enhance customer satisfaction.
Training and Development
In educational settings or corporate training programs, a Fishbone Diagram can be utilized to analyze challenges or obstacles hindering effective learning and development. It assists in identifying areas for improvement in training processes.
Strengths of Cause and Effect Diagrams
Visual Representation
One of the main strengths of cause and effect diagrams is their ability to provide a visual representation of complex issues. The diagram’s fishbone structure allows for a clear and organized display of potential causes and their relationships, making it easier for teams to understand and communicate.
Systematic Analysis
Cause and effect diagrams promote a systematic approach to problem-solving. By categorizing potential causes into major branches, teams can methodically explore and analyze each factor, leading to a comprehensive understanding of the root causes of a problem.
Collaborative Problem Solving
The creation of a cause and effect diagram often involves collaborative brainstorming sessions. This encourages team members to share their insights and perspectives, fostering a collaborative problem-solving environment that capitalizes on collective knowledge and expertise.
Identification of Multiple Causes
The diagram facilitates the identification of multiple causes contributing to a single problem. This multiperspective analysis helps ensure that the root causes are thoroughly explored, reducing the likelihood of overlooking critical factors.
Weaknesses of Cause and Effect Diagrams
Oversimplification
One weakness of cause and effect diagrams is the potential for oversimplification. The structured nature of the diagram may not capture the complexity or interdependencies of certain issues, leading to a superficial understanding of the problem.
Subjectivity in Prioritization
The prioritization of causes within the diagram can be subjective. Teams may struggle to objectively rank the importance of various factors, and the process may be influenced by individual perspectives, biases, or incomplete information.
Lack of Quantitative Data
Cause and effect diagrams are primarily qualitative tools and do not inherently incorporate quantitative data. While they are effective in identifying potential causes, they may not provide a precise measurement of the impact or significance of each cause, requiring supplementary quantitative analysis.
How to Create Fishbone Diagram Step-by-Step
Creating a Cause and Effect Diagram involves systemically identifying and categorizing potential causes of a specific problem. Here are the steps to create a cause-and-effect diagram:
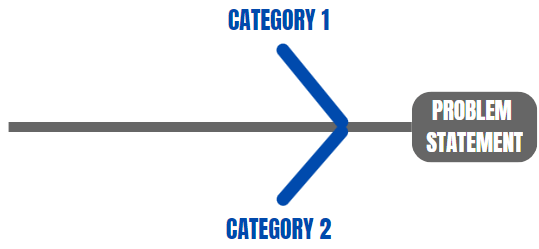
Step 1: Define the Problem Statement

Clearly articulate the problem or issue that you want to address. Write it as a concise statement at the “head” of the Fishbone Diagram.
Step 2: Identify Major Categories (Fishbone Bones)
The next step is to create the main branches, or “bones,” of the fishbone diagram.
Teams using cause-effect diagrams often use additional mnemonic lists to ensure a thorough consideration of potential causes. For example, the manufacturing industry frequently utilizes 5Ms, and the service industry often uses 5Ps.
| Manufacture | Service |
|---|---|
| Manpower | People |
| Materials | Provisions |
| Methods | Procedures |
| Machines | Place or Environment |
| Measurements | Patrons or Customers |
While these lists serve as helpful aids, they are not universally applicable, and individuals may create their own or modify existing ones. The key is to consider all potential sources of causation by asking targeted questions like, “What procedures might be causing this problem?”
Step 3: Brainstorm Causes Within Each Category
With your team, brainstorm potential causes within each category.
Encourage open discussion and gather as many ideas as possible. There are several techniques that may be helpful during the storming process.
- Use Affinity Diagrams to organize the information and group related ideas.
- Utilize 5 Whys Analysis to repeatedly ask why for a thorough cause and effect chain analysis.
- Ask the 4 Ws – What, Why, When, and Where to help explore the cause and effect.
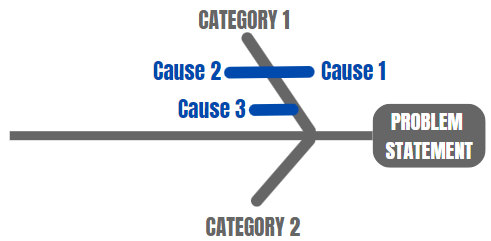
Step 4: Add Subcauses and Details
If necessary, the team can further expand on each identified cause by adding subcauses or specific details. This adds granularity to the diagram, making it more comprehensive.
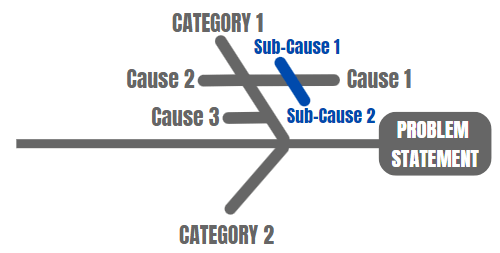
Using the image above, the team has identified two sub-causes for the main cause #1.
Continue this process until the team feels that the causes and sub-causes are sufficiently detailed. The team can continue to add additional sub-levels to sub-causes if necessary, although the diagram can become more difficult to visualize with multiple levels.
Step 5: Prioritize Causes
If applicable, prioritize the causes based on their significance. This can be done through team discussion, voting, or using data such as the Pareto Principle to identify the most critical factors.
Step 6: Review, Validate, and implement
Review the completed Fishbone Diagram with the team. Ensure that all relevant causes have been included and that the relationships between causes and effects are accurate. Finally, share the completed diagram with relevant stakeholders and use it as a visual aid to identify and solve the problem.
By following these steps, the team can utilize the Fishbone Diagram to systematically analyze complex problems, identify root causes, and drive effective solutions.
Tips for Creating a Cause and Effect Diagram
Here are some tips to enhance the process and maximize the value of the fishbone diagram:
Tips for Creating the Diagram
- Clearly Define the Problem: A well-defined problem statement ensures that the cause-and-effect analysis remains focused and relevant.
- Select Appropriate Categories: Tailor these categories to fit the specific context of your analysis.
- Use Facilitation Techniques: Employ facilitation techniques such as affinity diagrams to organize and group related causes. Or use the 5 Whys technique to dig deeper into the root causes of each identified issue.
- Keep it Visual and Simple: Maintain clarity and simplicity in the Fishbone Diagram. Use clear and concise language, and avoid overcrowding the diagram with excessive detail. Make the diagram easy to understand and communicate.
Tips for Collaboration
- Encourage Open Brainstorming: Encourage team members to share their insights and ideas freely. Avoid judgment during the initial brainstorming phase to stimulate creativity.
- Include Relevant Stakeholders: Involve stakeholders with diverse perspectives in the cause-and-effect analysis to capture a comprehensive view of the problem and its contributing factors.
- Review and Iterate: After creating the initial diagram, review it with the team to confirm its accuracy and completeness. Be open to feedback and make necessary adjustments and several iterations.
- Facilitate Follow-Up Action: Use the insights gained from the Fishbone Diagram to develop actionable plans and solutions. Assign responsibilities for implementing changes and track progress over time to ensure continuous improvement.
By following these tips, you can facilitate a more effective cause-and-effect analysis, leading to a Fishbone Diagram that serves as a valuable tool for problem-solving and decision-making.
Cause and Effect Diagram Examples
Here are three examples of Ishikawa Diagrams representing different scenarios:
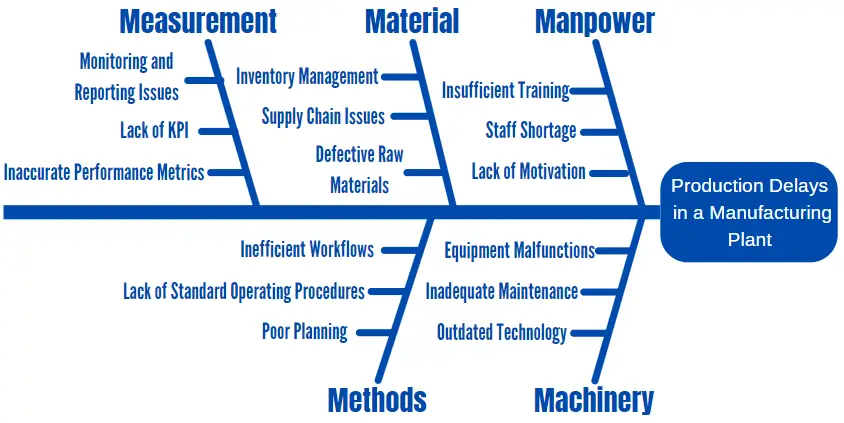
Example 1: Production Delays in a Manufacturing Plant
In this scenario, you are tasked with identifying the various factors contributing to production delays, allowing the team to identify root causes and implement targeted solutions.
Problem Statement: Unexpected delays in the production process lead to reduced output.
From the brainstorming exercise, the team identified the following causes within each category:
- Manpower: Insufficient Training, Staff Shortage, Lack of Motivation
- Machinery: Equipment Malfunctions, Inadequate Maintenance, Outdated Technology
- Material: Defective Raw Materials, Supply Chain Issues, Inventory Management
- Methods: Inefficient Workflows, Lack of Standard Operating Procedures, Poor Planning
- Measurement: Inaccurate Performance Metrics, Lack of Key Performance Indicators (KPIs), Monitoring and Reporting Issues
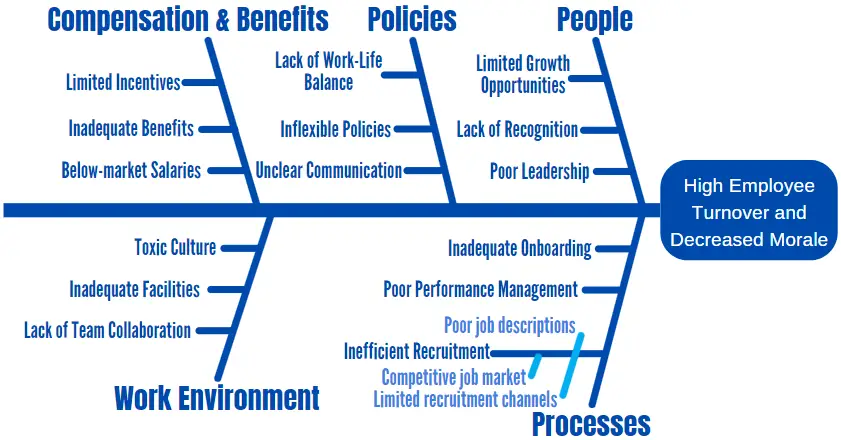
Example 2: High Employee Turnover in a Company
In this scenario, you are tasked with identifying the root causes of high employee turnover and guiding the development of strategies to improve retention.
Problem Statement: High turnover rates lead to instability and decreased morale among employees.
- People: Poor Leadership, Lack of Recognition, Limited Growth Opportunities
- Processes: Inefficient Recruitment, Inadequate Onboarding, Poor Performance Management
- Policies: Lack of Work-Life Balance, Inflexible Policies, Unclear Communication
- Work Environment: Toxic Culture, Inadequate Facilities, Lack of Team Collaboration
- Compensation & Benefits: Below-market Salaries, Inadequate Benefits, Limited Incentives
While taking a deep dive and examining the potential causes of insufficient recruitment, the team identified poor job descriptions, limited recruitment channels, and a competitive job market.
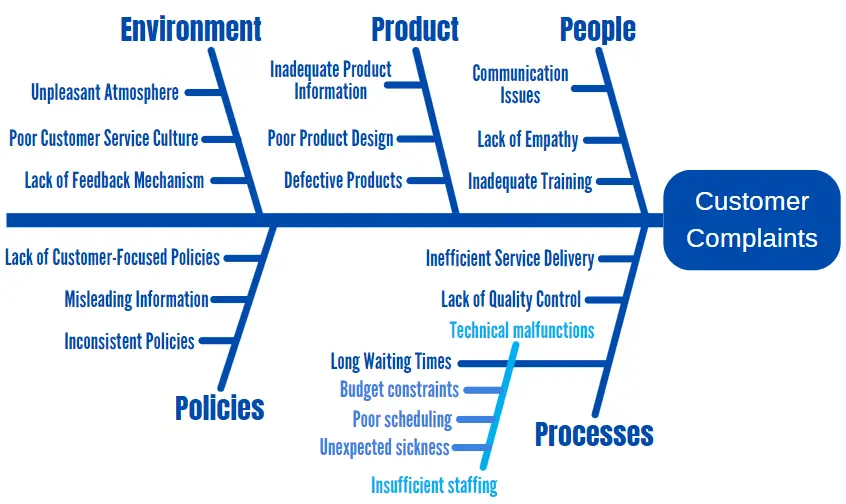
Example 3: Customer Complaints in a Service Industry
In this scenario, you are tasked with understanding the causes of multifaceted customer complaints and helping the organization to enhance its service quality and address customer concerns effectively.
Problem Statement: Increasing customer complaints leads to a decline in customer satisfaction.
- People: Inadequate Training, Lack of Empathy, Communication Issues
- Process: Inefficient Service Delivery, Long Waiting Times, Lack of Quality Control
- Product: Defective Products, Inadequate Product Information, Poor Product Design
- Policies: Inconsistent Policies, Lack of Customer-Focused Policies, Misleading Information
- Environment: Unpleasant Atmosphere, Poor Customer Service Culture, Lack of Feedback Mechanism
While taking a deeper dive into the long waiting time, the team identified insufficient staffing, and technical malfunctions as potential causes.
As the team continued to look into the cause of insufficient staffing, the team identified budget constraints, poor scheduling, and unexpected sickness as the causes.
Cause And Effect Diagram Complimentary Techniques
While the Fishbone Diagram (Ishikawa Diagram) is the most well-known type of Cause and Effect Diagram, there are other variations and complementary techniques used for cause and effect analysis. Here are some notable ones:
Affinity Diagram
An affinity diagram serves as the starting point by organizing diverse ideas and grouping them into clusters. It acts as a foundation for the fishbone diagram, which then delves into a more detailed analysis of root causes within specific categories.
Together, these tools provide a comprehensive approach to problem-solving, transitioning from idea generation and organization to in-depth cause-and-effect analysis.
5 Whys Analysis
Although not a diagram per se, the 5 Whys is a questioning technique that helps delve deeper into the root cause of a problem. It involves asking “Why?” repeatedly (typically five times) to trace the cause-and-effect chain until the fundamental issue is uncovered. The 5 Whys Analysis is often used in conjunction with Fishbone Diagrams for a more thorough investigation.
Pareto Chart
A Pareto Chart is often used in conjunction with Fishbone Diagrams. It helps prioritize issues by illustrating the relative importance of different causes. The Pareto Principle suggests that 80% of problems may be attributed to 20% of the causes, guiding teams to focus on the most significant contributors.
FAQ
How do I prioritize causes in a Fishbone Diagram?
Causes can be prioritized based on their significance or impact. This can be done through team discussion, voting, or using data such as the Pareto Principle to identify the most critical factors that require immediate attention.
Can I use a Fishbone Diagram for project planning?
Yes, a Fishbone Diagram can be a useful tool in the planning phase of a project. It helps anticipate potential challenges, risks, and issues, allowing teams to develop proactive strategies for successful project outcomes.
How often should I revisit a Fishbone Diagram?
Revisit a Fishbone Diagram as needed, especially when there are changes in the problem, new information becomes available, or when monitoring progress on implemented solutions. It’s a dynamic tool that can be iteratively improved over time.
What is the difference between an affinity diagram and a fishbone diagram?
An affinity diagram is used for brainstorming and organizing ideas, providing a foundation for a Fishbone Diagram. The Fishbone Diagram then conducts a more detailed analysis of root causes within specific categories identified by the affinity diagram. They work together in a collaborative problem-solving process.
What are the 6 elements of a Fishbone Diagram?
The Fishbone Diagram typically consists of six major elements or “bones.” These elements represent different categories under which potential causes of a problem are grouped. The six categories are People, Processes, Equipment, Materials, Environment, and Management. Each category helps organize and analyze potential causes systematically, providing a comprehensive view of the factors contributing to a specific issue.